

According to Spotify, one of the albums I have spent the most time listening to is The Irish Volunteer by David Kincaid, which tells the story of Irish immigrants who served in the Union Army during the Civil War. This music is admittedly niche today — Kincaid has 34,775 monthly listeners, most of them probably dedicated Hibernophiles like me — but its themes would have resonated with large swathes of the Union forces. Historian Damian Shiels estimates that around 180,000 Irish-born soldiers and sailors fought for the North and at least 20% of the Navy and Regular Army were from the Emerald Isle.
A century and a half later, the names on the muster rolls have changed, but immigrant service members continue to help fill out our ranks. According to a February 2026 Congressional Research Service report by Holly Straut-Eppsteiner, roughly 50,000 foreign nationals are currently serving in the active and reserve components of the U.S. Armed Forces. My latest research looks at how the composition of that population and the institutional pathways that produce it have shifted dramatically since the volunteers in Kincaid’s songs stepped off the boat.
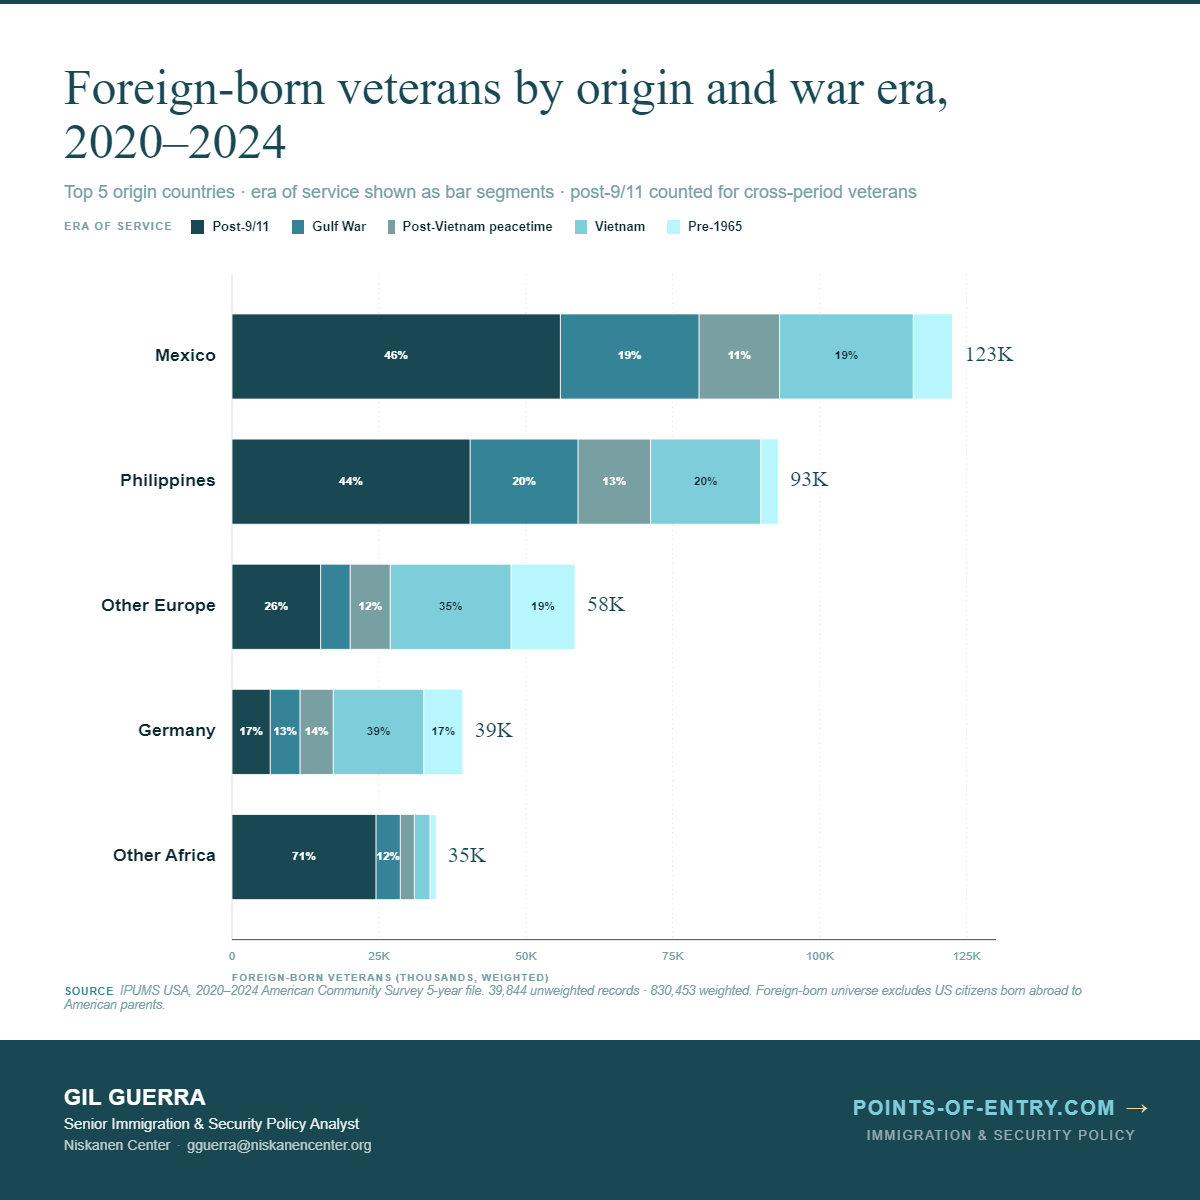
About 830,000 veterans and active-duty service members were born abroad. One in four of this group was born in Mexico or the Philippines.
I pulled the 2020–2024 American Community Survey 5-year file from IPUMS and filtered the approximately 830,000 foreign-born veterans and active-duty service members by country of birth and era of service.
I found that Mexico (~123,000) and the Philippines (~93,000) together account for more than a quarter of all foreign-born veterans in the country. Both populations skew heavily towards post-9/11 service: 46% of Mexican-born and 44% of Filipino-born veterans served in that era. This aligns with the relative youth of these immigrant communities and the demographic profile of the post-2001 all-volunteer force.
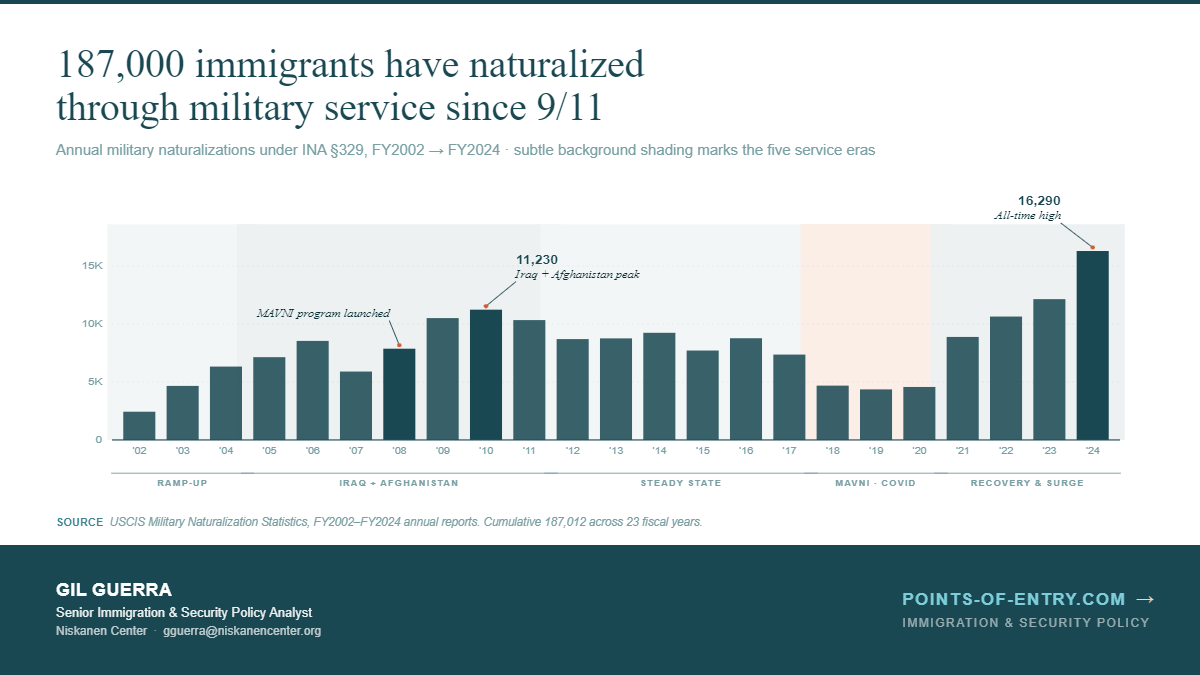
187,000 immigrants have naturalized through military service since 9/11.
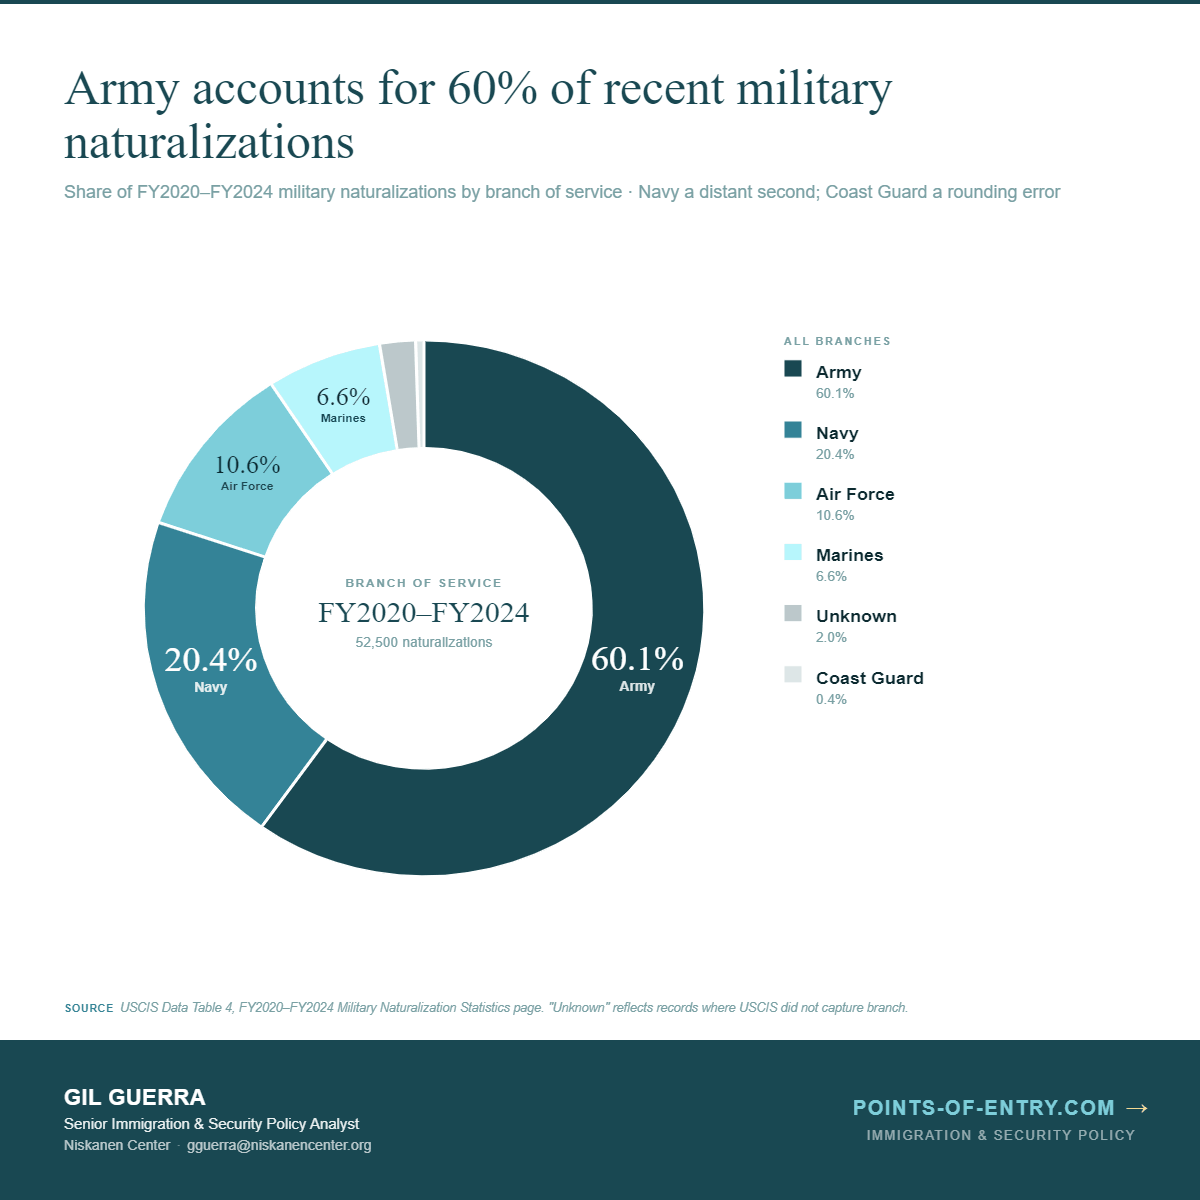
USCIS data shows that the 52,500 military naturalizations completed in FY2020–FY2024 were heavily concentrated in the Army, which alone accounts for 60% of the total. The Navy was a distant second at 20%, the Air Force was 11%, and the Marines were 7%. Some of this tracks relative branch size, but the Army runs ahead of its share of total end strength — a signal that it either recruits a higher proportion of non-citizens or moves them through the naturalization process faster than its sister services.
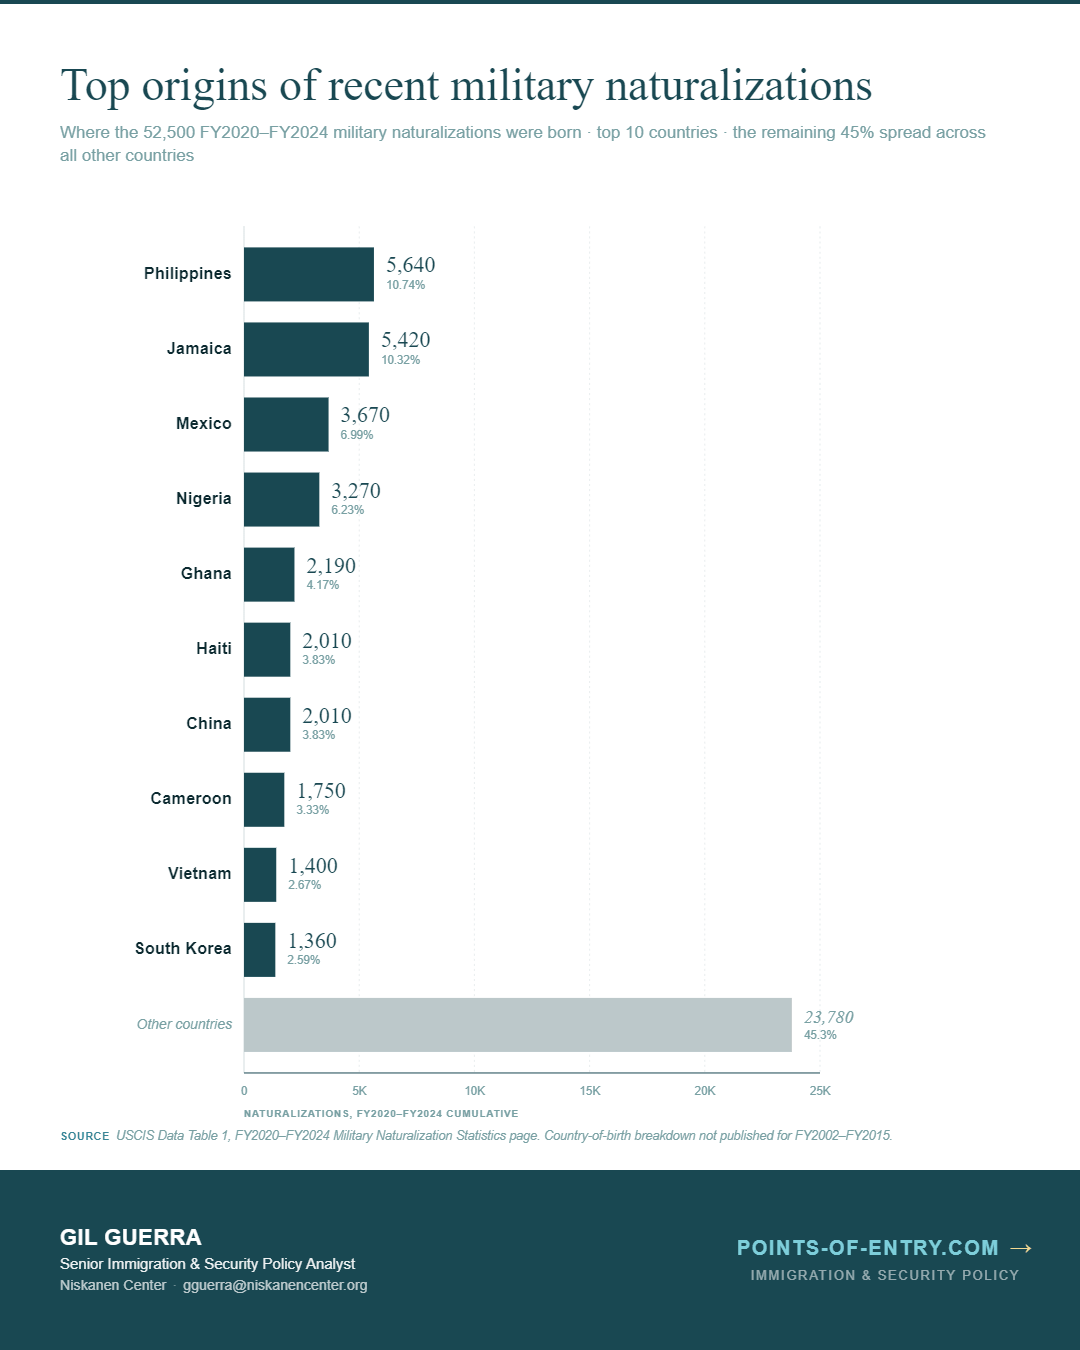
The country-of-birth mix for recent naturalizations looks meaningfully different from the overall veteran-stock picture. The Philippines (5,640) and Jamaica (5,420) lead, each at roughly 10% of the five-year total. Mexico, the runaway leader in foreign-born veterans overall, sits at #3 with just 7%. Nigeria, Ghana, and Cameroon together contribute nearly 14%, more than any single country except the top two.
Stacked across the 23 fiscal years since naturalization through military service was reactivated after 9/11, cumulative military naturalizations come to 187,012. The annual series has clear inflection points: a ramp-up through the early Iraq and Afghanistan years, a peak of 11,230 in FY2010, a plateau in the 7,000–9,000 range through the mid-2010s, a sharp drop during the suspension of the immigrant-recruitment program MAVNI and COVID period (down to roughly 4,500 in FY2019), and a steep recovery to an all-time high of 16,290 in FY2024. That last number is the most active year for military naturalization in the entire post-9/11 era.
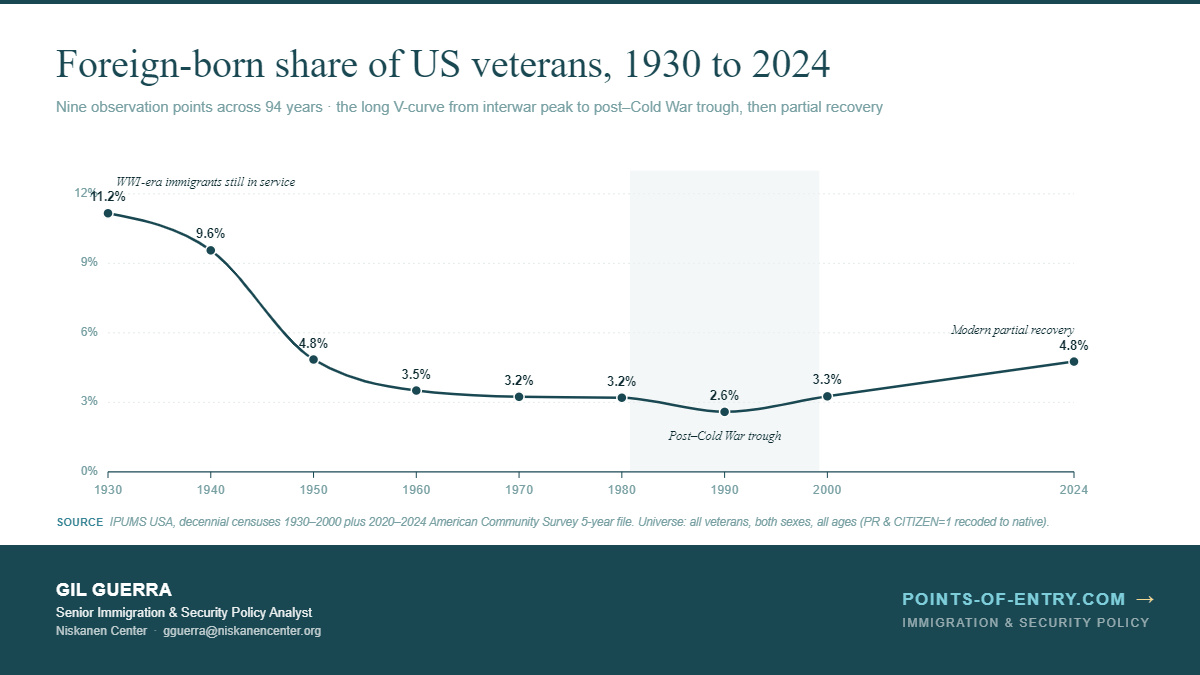
The foreign-born share of US veterans has steadily increased in recent years.
The foreign-born share of veterans hit 11.2% in 1930, fell to a 2.6% trough in 1990, and recently recovered to 4.8% in 2024. The 1930 peak is an echo of the 1880–1924 immigration wave, when millions of European arrivals who served in WWI were still on the rolls. The drop reflects two compounding pressures: the 1924 Johnson-Reed Act squeezed the inflow for four decades, and the WWI-era cohort gradually aged out. Hart-Celler immigrants from 1965 took until the 1980s and 90s to reach veteran age, which is why the trough lines up with that decade rather than earlier.
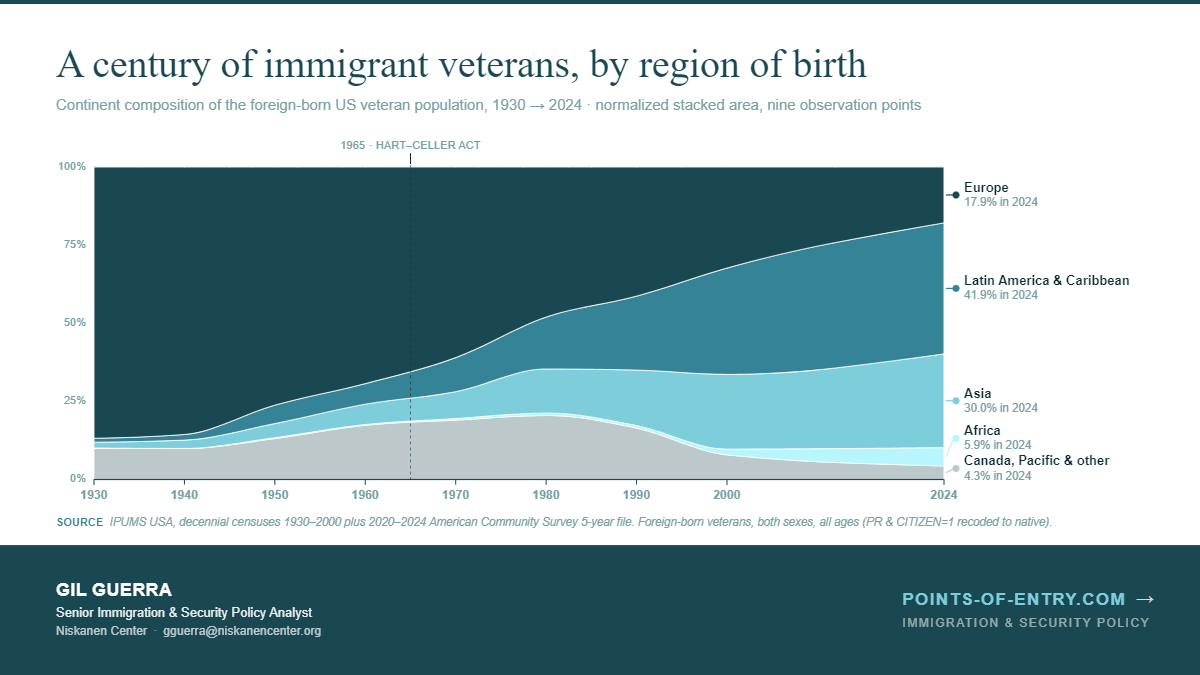
The composition chart shows what changed underneath the aggregate. In 1930, foreign-born veterans were almost entirely European. By 2024, Europe is down to 17.9%, Latin America and the Caribbean is the plurality at 41.9%, Asia is 30%, and Africa has emerged at 5.9%. The 1965 marker is where the curves start to bend in earnest, thanks to Hart-Celler ending the national-origins quota system and ultimately producing a veteran population whose regional origins looked very different from the previous generation.
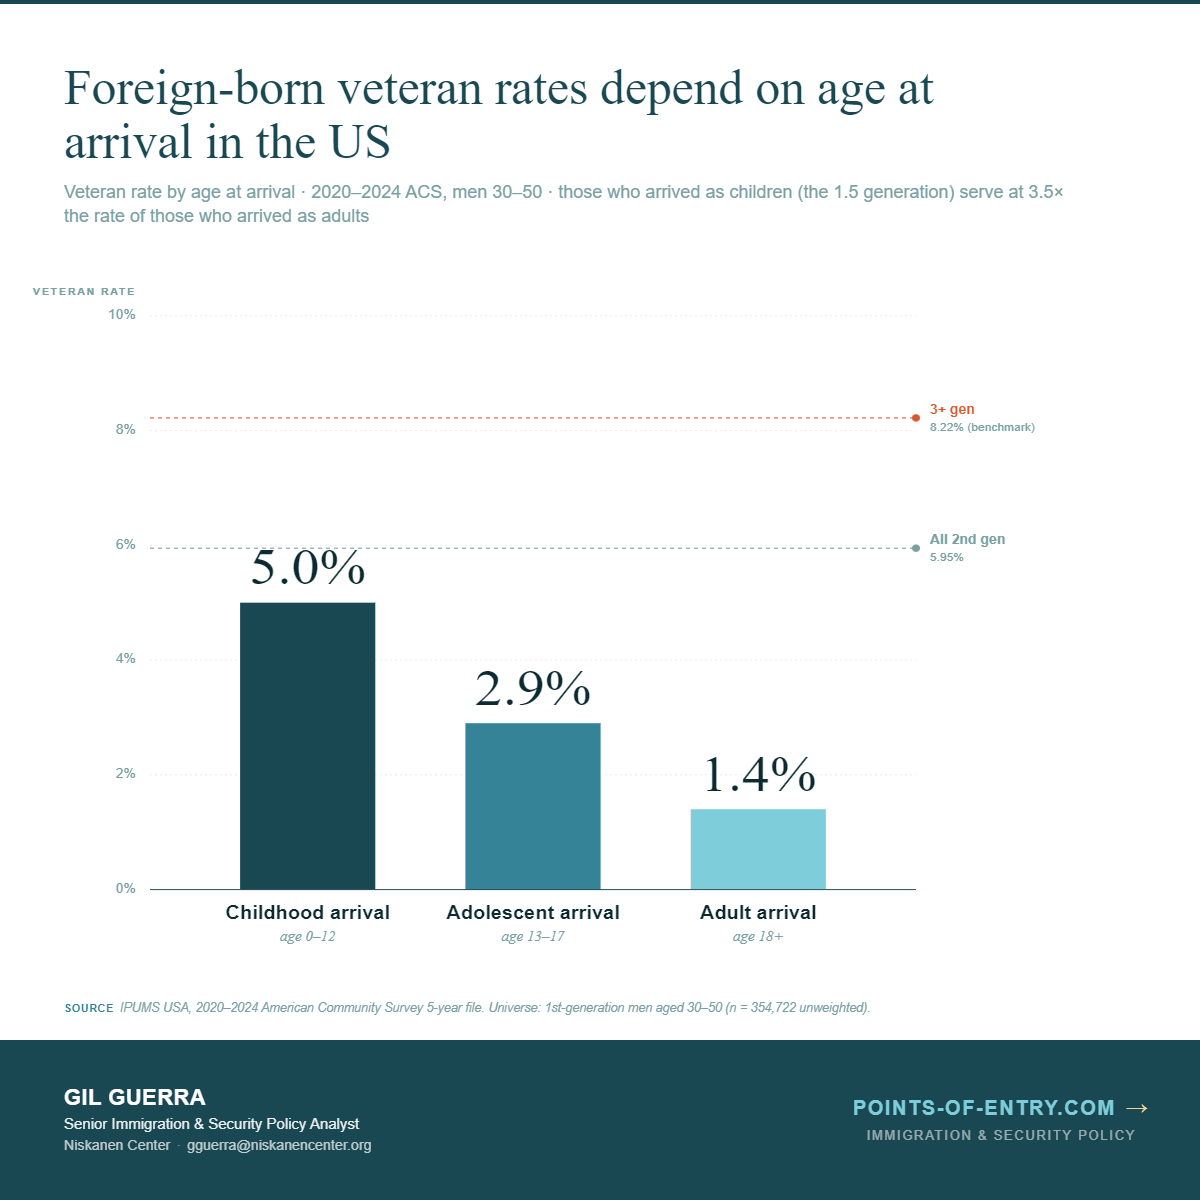
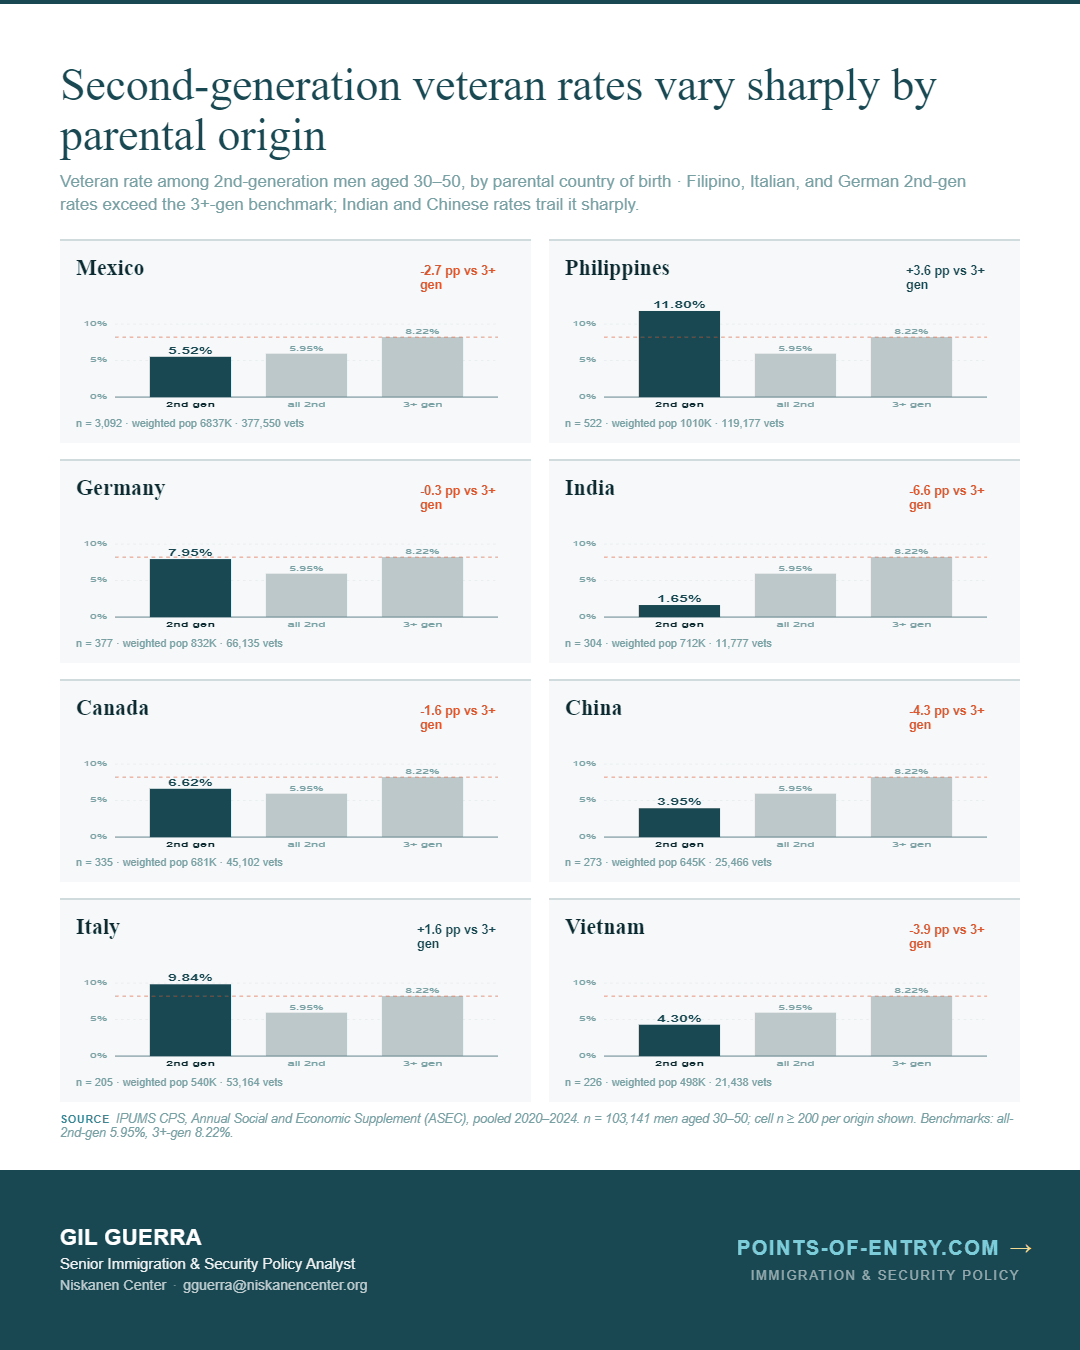
Rates of military service can vary by generation and origin.
Among first-generation men aged 30–50, age at arrival matters enormously. Childhood arrivals (0–12) serve at 5.0%, adolescent arrivals at 2.9%, and adult arrivals at just 1.4% — a 3.5× gap end-to-end. The childhood-arrival rate sits just under the all-2nd-generation benchmark of 5.95%, which is the cleanest evidence that early socialization in U.S. institutions (as well as age eligibility) drives propensity to serve. The “1.5” generation behaves more like its native-born peers than its parents.
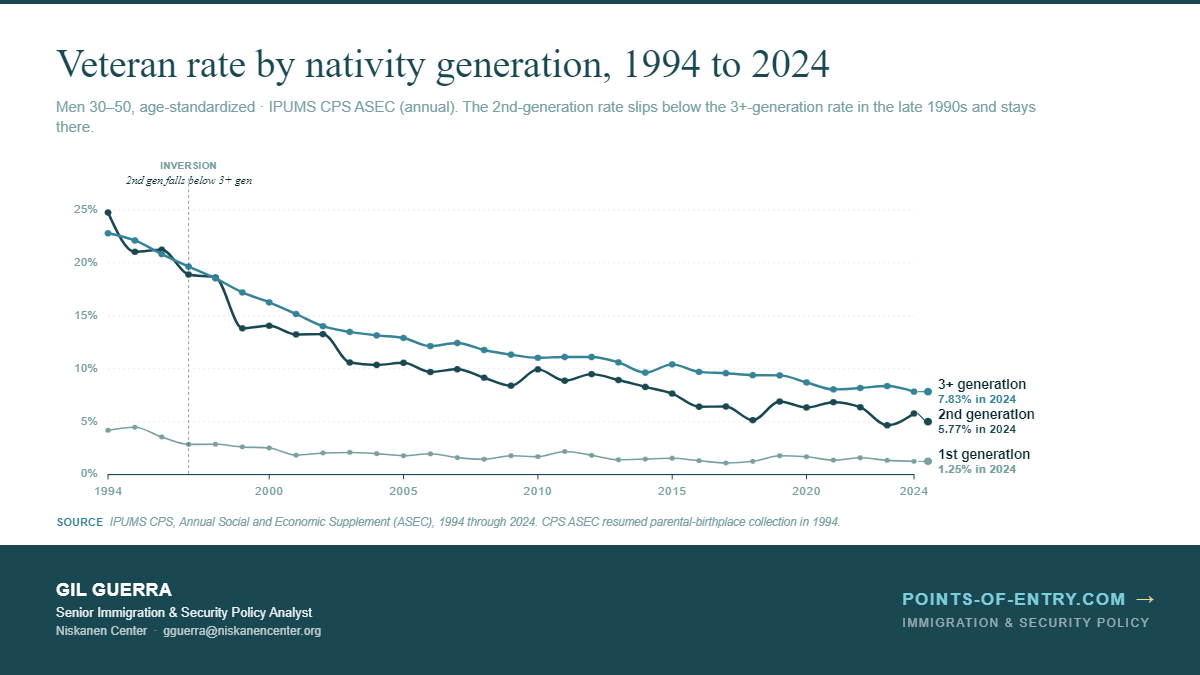
Every nativity generation has seen its veteran rate fall since 1994 — 3+ generation from roughly 22% to 7.83%, 2nd from 25% to 5.77%, 1st from 4% to 1.25%. Some of this is mechanic (recent years don’t reflect active-duty service members who will become veterans later on), but the structurally interesting feature is the late-1990s inversion, when the 2nd-gen rate slipped below the 3+ gen rate and stayed there. The gap sits at about 2 points today, a reversal from the mid-1990s, when children of immigrants enlisted at slightly higher rates than the longer-rooted native population.
The all-2nd-gen rate hides wide variation by parental origin. Filipino 2nd gen serve at 11.80% (above even the 3+ gen benchmark) and Italian 2nd gen at 9.84%, both reflecting deep institutional and community ties to U.S. military service. German 2nd gen sit essentially at the benchmark (7.95%). Indian 2nd gen, by contrast, serve at 1.65%, a 6.6-point gap below the 3+ gen rate; Chinese 2nd gen at 3.95%, Vietnamese at 4.30%. Mexican 2nd gen come in at 5.52%, slightly below the 2nd-gen average, but represent more veterans than every other origin on the chart combined.
Final thoughts.
Immigrant service members have played an important role in every conflict the United States has been involved in since the Revolution. The composition has changed dramatically over time, but the underlying contribution has been durable across quota regimes, two world wars, and the transition to the all-volunteer force. Immigration policy is not external to American military power — decisions about who gets to come, and on what terms, are also decisions about who gets to serve.
If you have any questions about these data or any of these findings, please reach out to me at gguerra@niskanencenter.org.
P.S. — I was recently honored to be the first guest author on Alexander Kustov’s must-read Substack, Popular by Design. Alex is one of the most interesting thinkers in immigration policy and is well worth a follow. You can read my post and subscribe to him via the button below.