
Marriage and the Melting Pot: What Census Data on 19 Million Americans Reveals About How Immigrants' Children Married into the Mainstream
Part 1 of a four-part series on second-generation marriage patterns, 1880–1930

I spend an inordinate amount of time doing two things: scrolling through the “Early Life” section of notable people’s Wikipedia pages and explaining how to pronounce “Niskanen” (“Nis-KAN-en”).
While partaking in the first activity, I noticed that the namesake of my think tank, William “Bill” Niskanen, was missing the usual blurb explaining his family roots and the origin of his unusual surname.
After some digging around online, I located Niskanen’s family tree. In doing so, I discovered that his father, William A. Niskanen Sr., was the American-born son of Finnish immigrants who settled in the United States in 1899, while his mother, Nina McCord, was the daughter of two Americans from Minnesota (one from a place called “Brainerd,” which is pronounced “Bray-nerd,” though I seem to recall hearing a different pronunciation directed my way in elementary school).
Part of my job at Niskanen is to study assimilation, so I became interested in finding out how common or uncommon marital pairings like this were at the time. What does marriage have to do with assimilation? In my view, marriage is one of the best indicators of assimilation we have. Whom you marry reveals whom you know, whom your family will accept, and the cultural world your children will be raised in.
With this in mind, I spent the past several months building an interactive dashboard that draws census microdata from 1880 to 1930 representing 19.1 million people to explore how the children of immigrants who came during America’s first great migration wave married. Now you can explore the data, too.
This post is the first of a four-part series that dives into what I found. Below, I lay out the big picture — how second-generation Americans married into the mainstream and how this varied according to parental origin. Part 2 looks at who married whom, and in particular which immigrant-descended groups found each other and which actively avoided one another. Part 3 will go deeper into geography, testing how much of the assimilation spectrum was culture and how much was simply a matter of location. Part 4 will turn these historical findings loose on contemporary debates about assimilation and take your questions.
The Two Paths to Assimilation
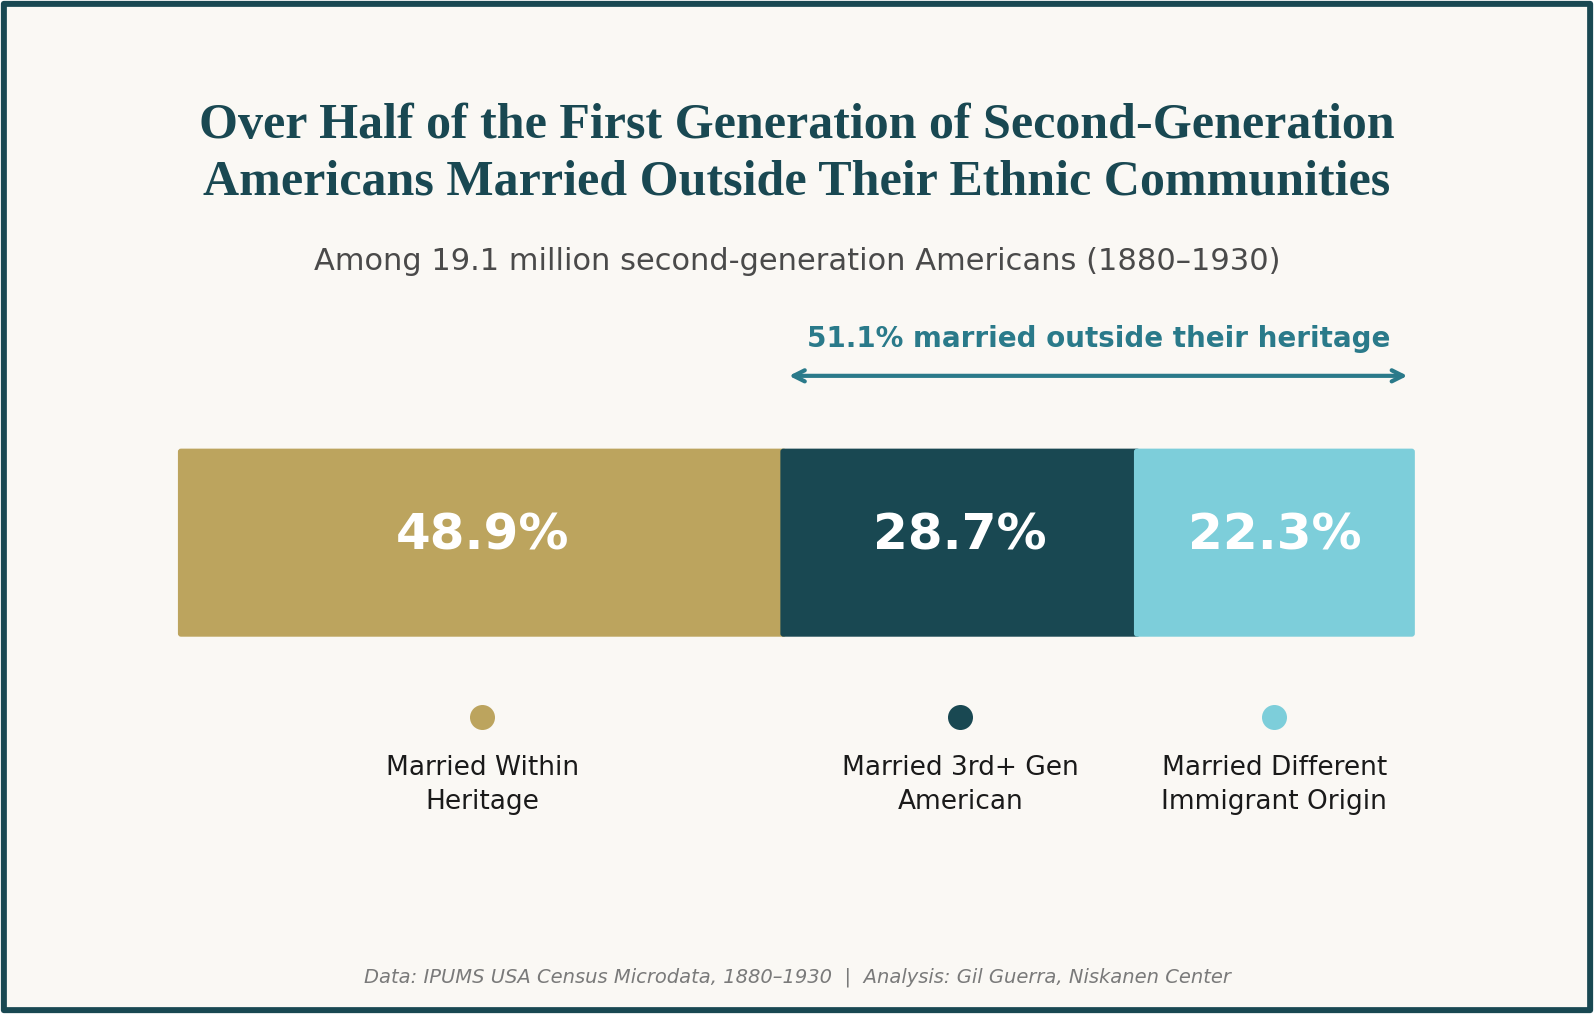
My topline finding is deceptively simple. Among second-generation Americans with at least one foreign-born parent, 51.1 percent married someone from a different ethnic background.
But that majority conceals an important distinction. Of the 51.1 percent who married out, 28.7 percent married a third-generation-or-later American, someone with no traceable recent immigrant ancestry. This is the “mainstream” path, and the version of assimilation that Bill Niskanen’s parents took: an immigrant family arrives, children marry into the broader population, and ethnic identity fades within a generation or two.
The remaining 22.3 percent crossed ethnic lines but married into other immigrant communities rather than the mainstream, a different kind of boundary-crossing that we’ll return to in Part 2.
The Vast Range in Rates of Marriage into the American Mainstream
The aggregate numbers, however, obscure an enormous range in how different groups married into established American communities.
The dashboard ranks 25 origin groups by their rate of marriage into the mainstream. Before looking at the graphic below, take a guess: How likely were the children of Finnish immigrants to marry into a family with American roots, as Bill Niskanen’s father did?
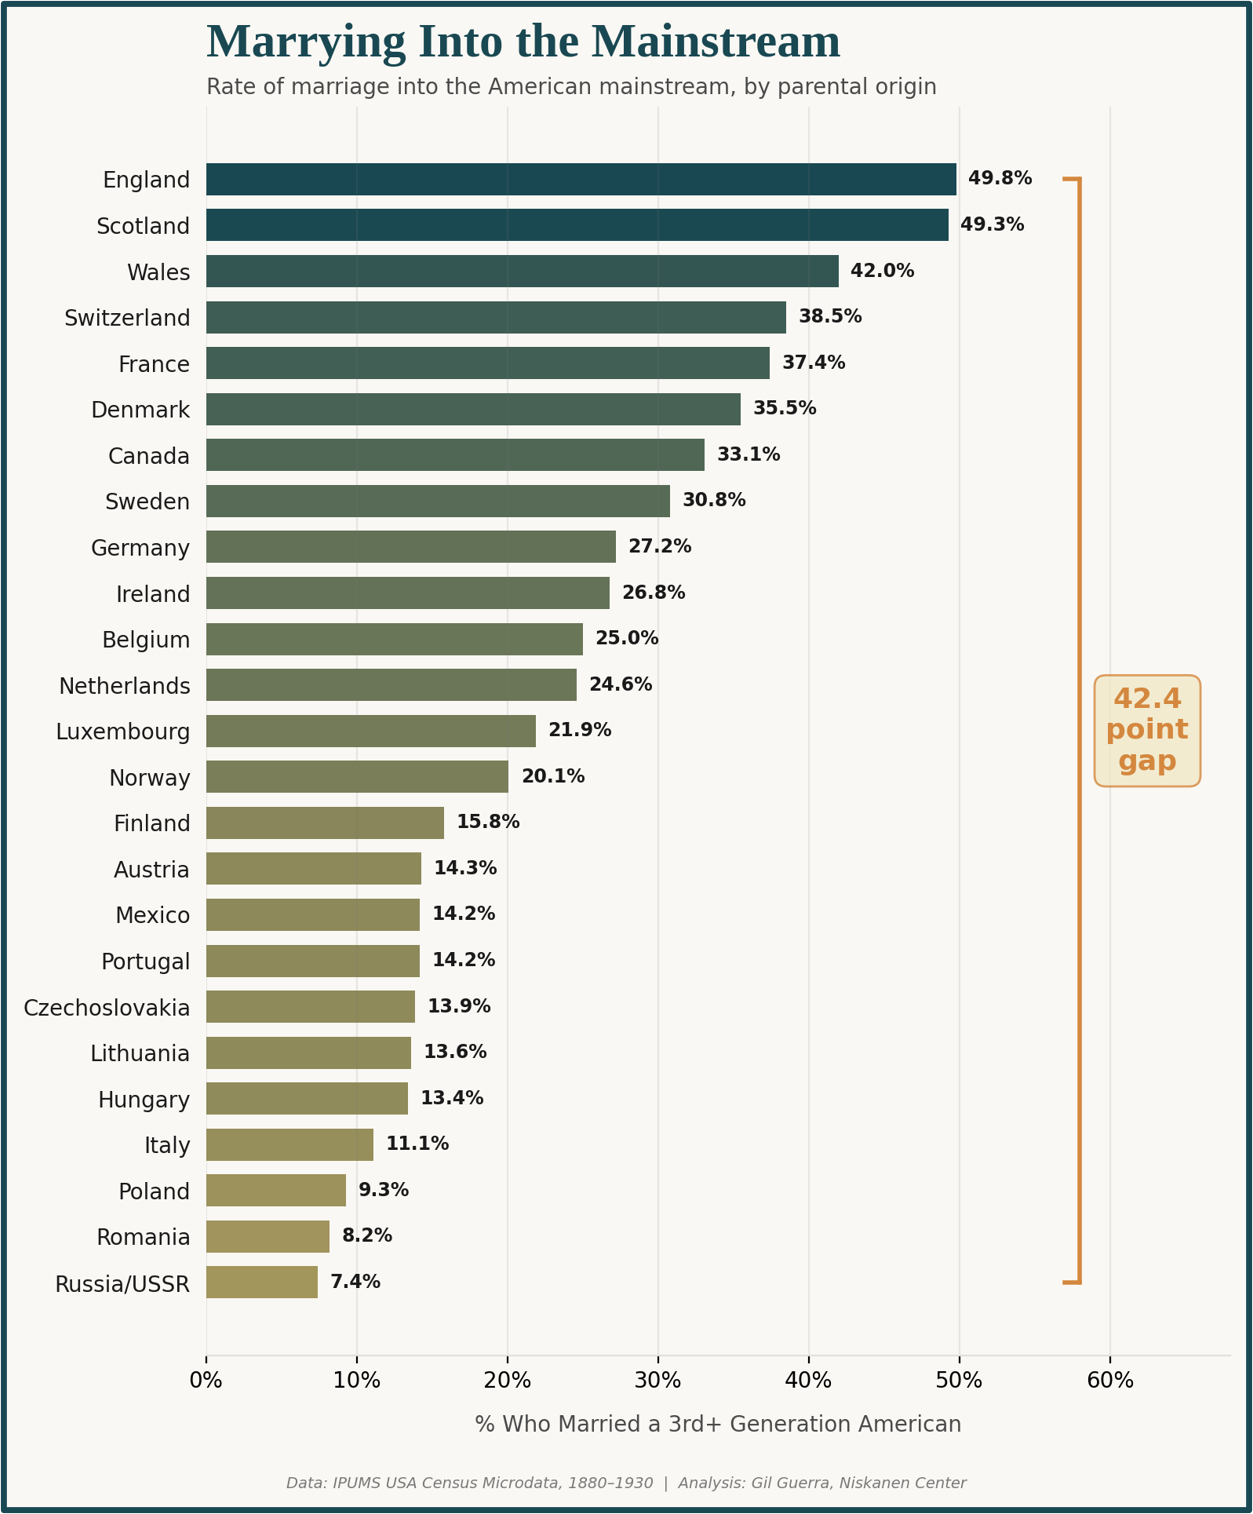
If you guessed 15.8%, you should pursue a career in prediction markets.
Finnish Americans landed in the middle of the spectrum, which is where the most interesting findings are. Mexican Americans, at 14.2 percent, matched or exceeded the mainstream marriage rates of Italian, Hungarian, Lithuanian, Czechoslovakian, and Portuguese Americans. Danish Americans sat 15 points above Norwegian Americans despite their ostensibly similar cultural backgrounds. Swiss Americans, despite not having roots in an Anglophone country, ranked fourth, while Irish Americans, who did, landed six spots below them.
The extremes held fewer surprises. English and Scottish Americans had the highest rates of mainstream marriage, Russian and Polish Americans rounded out the end — but even the familiar endpoints gain new meaning once you see who falls in between.
What Opened the Door
What distinguished those who married into the mainstream from those who did not? Two factors stood out above everything else: having an American-born parent, and having parents from two different countries.
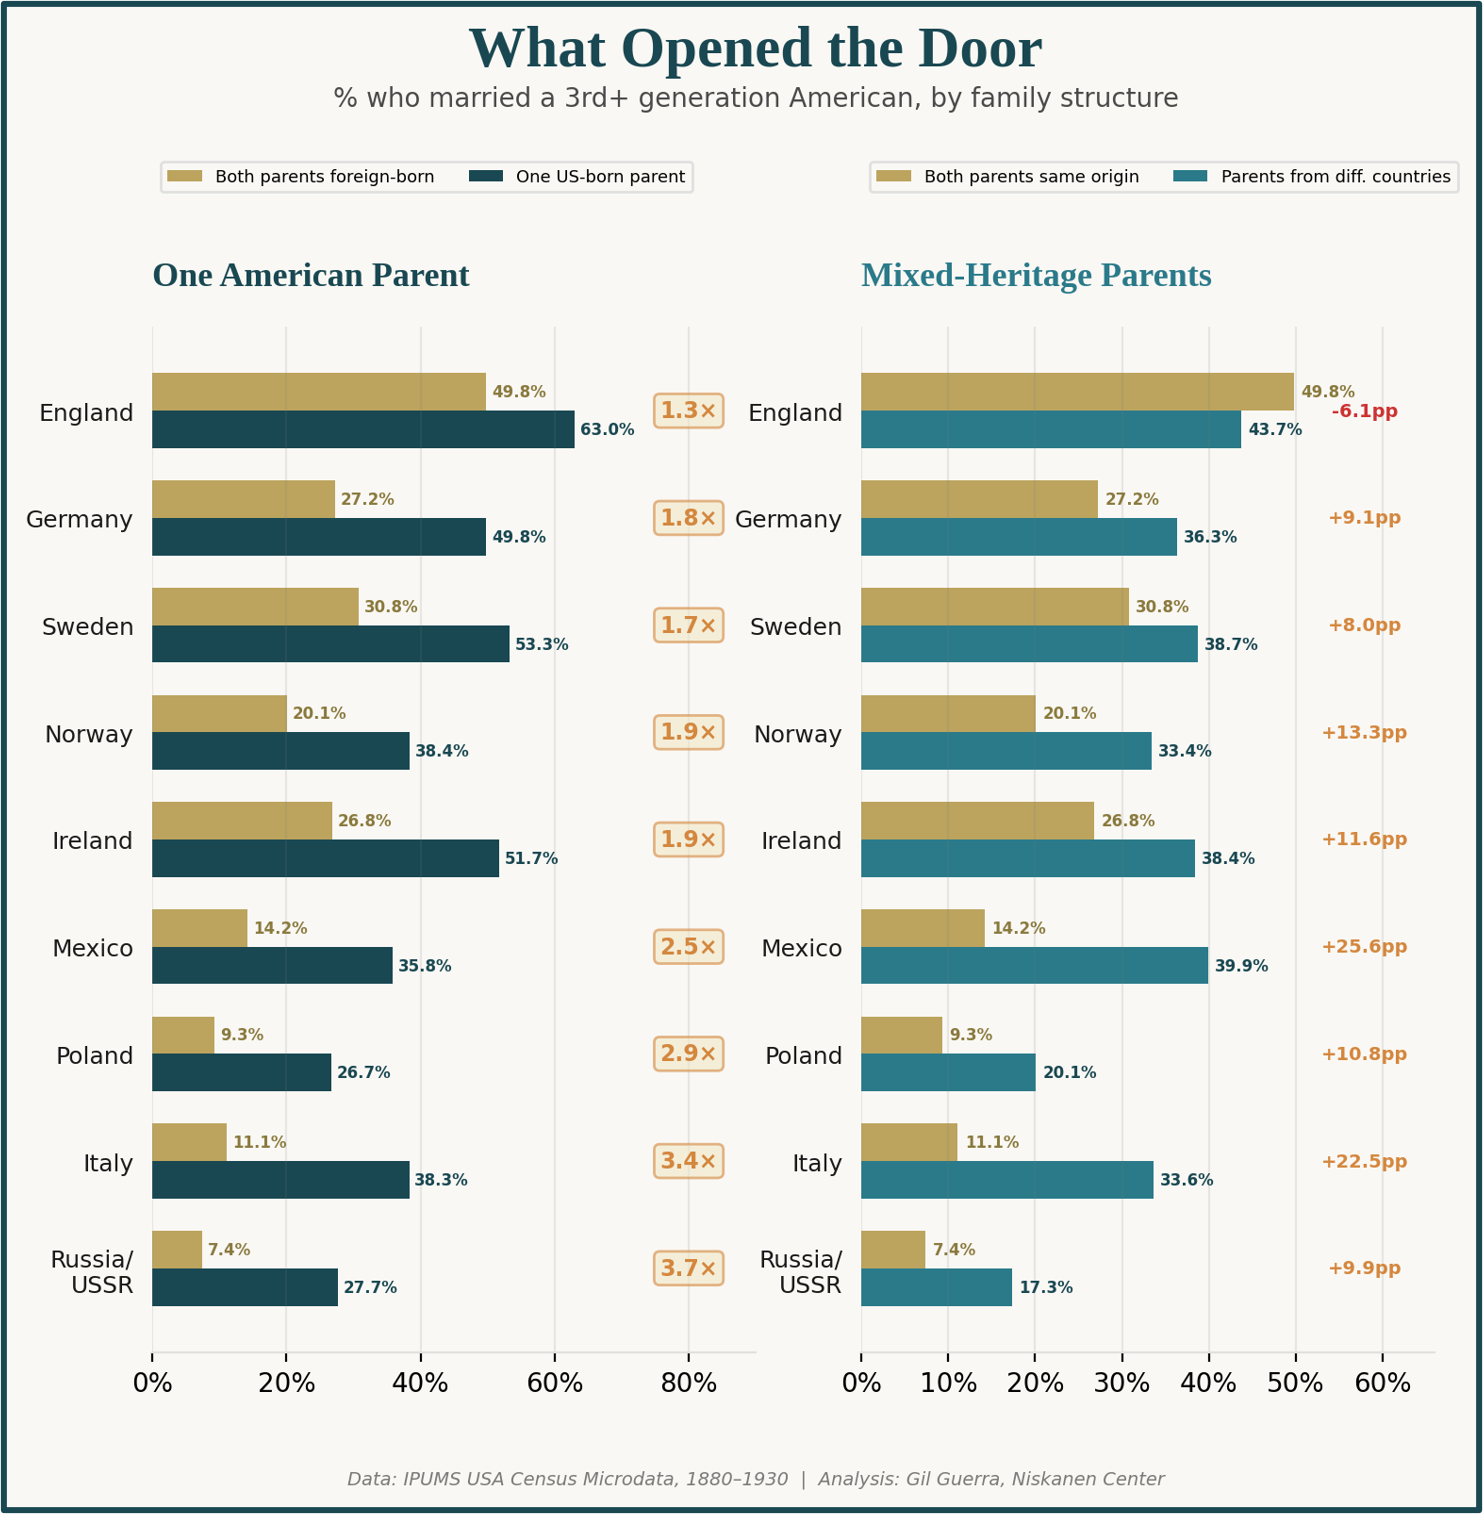
The American-parent effect was enormous — and strongest precisely where integration was hardest. Second-generation Russian Americans with two foreign-born parents married into the mainstream at 7.4 percent. When one parent was U.S.-born, that figure nearly quadrupled to 27.7 percent. The pattern is consistent and striking: having one foot in the door made the second step shorter.
Mixed-heritage parents told a similar story. When both parents came from the same country, mainstream marriage rates tracked the spectrum shown above. When parents came from two different countries — for example, a German mother and a Norwegian father — rates jumped across the board: 9 points for Germany, 13 for Norway, 22 for Italy.
The one exception was England, where mixed heritage actually lowered the mainstream rate by 6 points, probably because marrying into another immigrant community pulled English-origin children away from a mainstream they were already part of. For everyone else, parents who had already crossed one boundary raised children who crossed another.
What Held the Line
If having an American parent was the strongest accelerator of integration, gender was the strongest brake — and the pattern ran in one direction. In every major group except Norwegian Americans, women married within their heritage community at higher rates than men. For most groups, the gap was modest, running from 2 to 6 percentage points.
Italy was in a different category entirely.
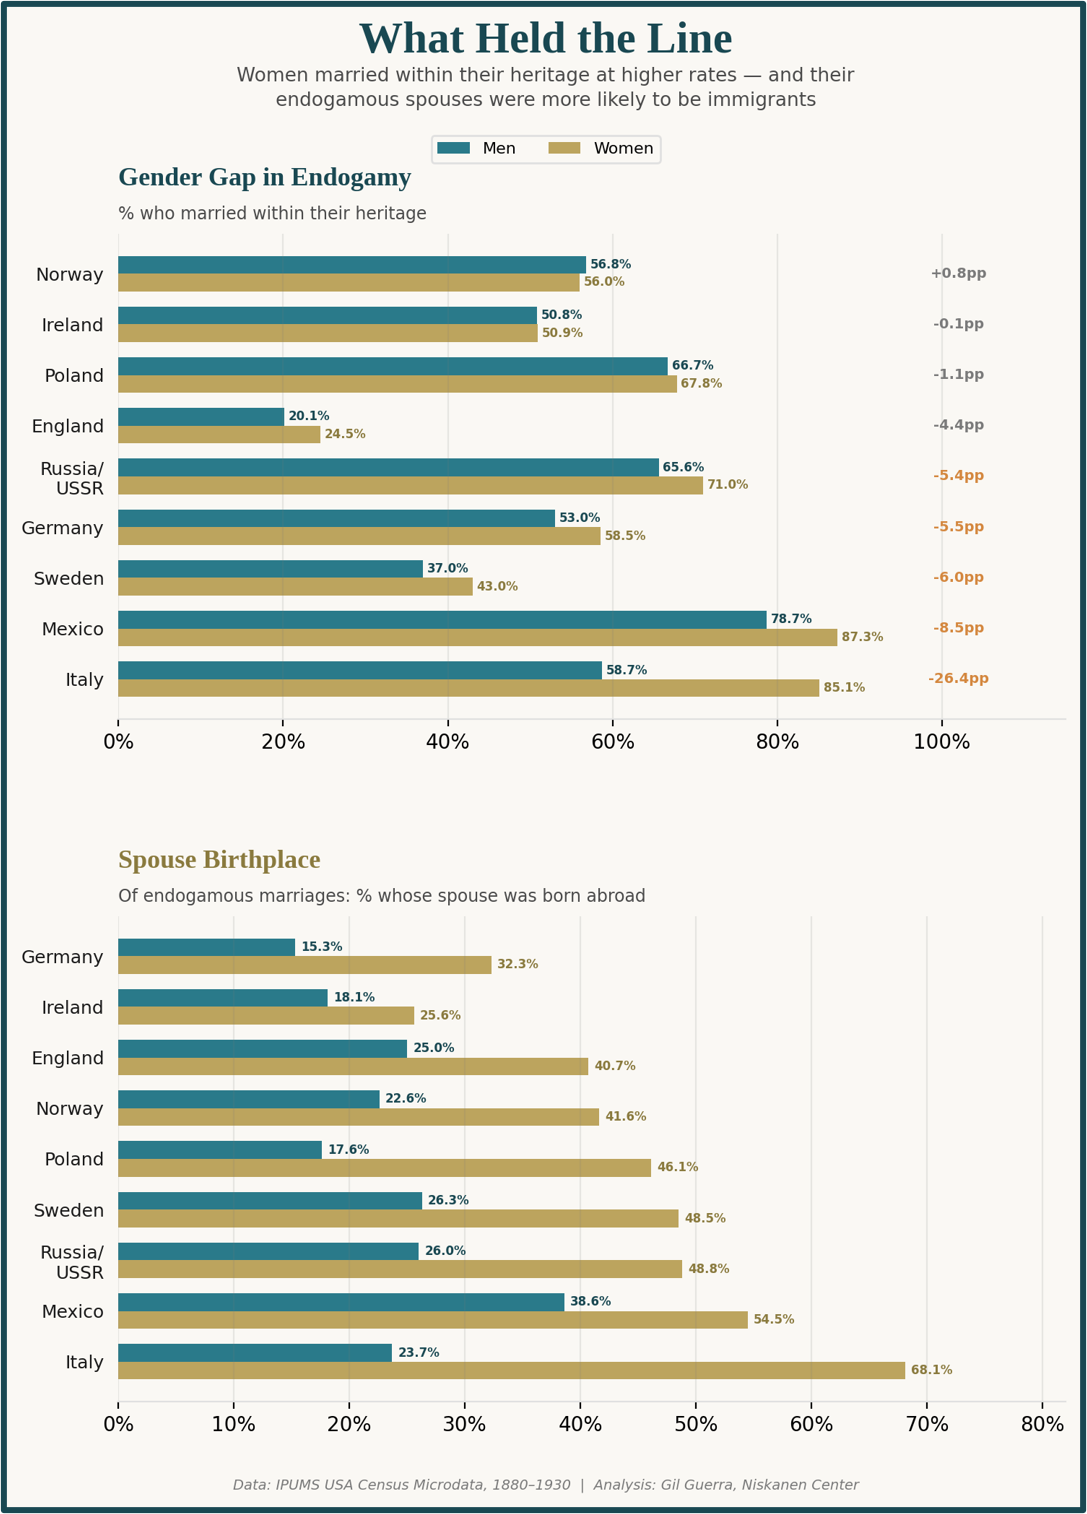
Italian American men married within the Italian community at 58.7 percent. Italian American women married within the community at 85.1 percent. This 26-point gap was more than triple the next largest, and wider than the spread of Mexican, Swedish, German, and Russian Americans combined.
The raw gap alone doesn’t capture what was actually happening inside these families. Of Italian American women who married within the Italian community, 68.1 percent married a first-generation Italian immigrant. For Italian American men who married within the community, only 23.7 percent married an Italian immigrant.
The Italian case was extreme, but the direction was nearly universal. Across eight of nine major groups, women were more likely than men to marry within their community, and more likely to marry someone born abroad when they did. The melting pot did not operate equally for sons and daughters.
What the Melting Pot Actually Looked Like
The data paints the portrait of not one melting pot, but of dozens — heated unevenly and stirred at different speeds. While a slim majority of second-generation Americans married outside their heritage community overall, for some groups the share that did was overwhelming, and for others it was almost negligible.
Some factors mattered more than others in determining who entered the mainstream. Having an American-born parent could quadruple a group’s rate of integration. Being a woman could cut it in half. The same country, the same state, the same decade — entirely different outcomes emerged depending on which side of these lines someone fell on.
The aggregate numbers can take us only so far. They tell us that 51.1 percent married out, but they don’t tell us whom they married, or what invisible walls stood between communities that shared cities, workplaces, and pews. In Part 2, we’ll look at the patterns for the 22 percent who married between immigrant groups: who found each other, who avoided each other, and why Irish and Russian communities — even when they lived in the same neighborhoods — avoided intermarriage at a rate of more than 97 percent.
If you want to explore the data yourself before the next installment, the full interactive dashboard is here. If you have any questions you’d like me to take up in a future installment, email me at gguerra@niskanencenter.org or head to the comments section. And if you enjoyed this entry and would like to follow the series, I hope you’ll subscribe below.