
German Grooms, Irish Brides: How Immigrant Communities Married Into Each Other
Part 2 of a four-part series on second-generation marriage patterns, 1880-1930.

Al Capone was an unusual man in many respects. In addition to bootlegging, tax evasion, and dispute-resolution methods not typically covered in the Harvard Business Review, his marriage to Mae Josephine Coughlin — the daughter of two Irish immigrants — fell outside the norm as well.
In the 1920 census, only 6.2% of Italian American men were married to Irish American women. In Illinois, where Capone and Coughlin settled so that Capone could pursue his career as a “used furniture dealer,” the proportion was an even lower 3.9%.
Why did Irish and Italian Americans marry each other at far lower rates than we’d expect given their shared religion, cities, and socioeconomic status? As shown in Part 1, my research on census microdata from 1880 to 1930 covering 19.1 million people revealed that a little over a fifth of all second-generation Americans married someone from a different immigrant community. But, as we’ll see, there were clear patterns and preferences in who married whom.
The German-Irish Duopoly
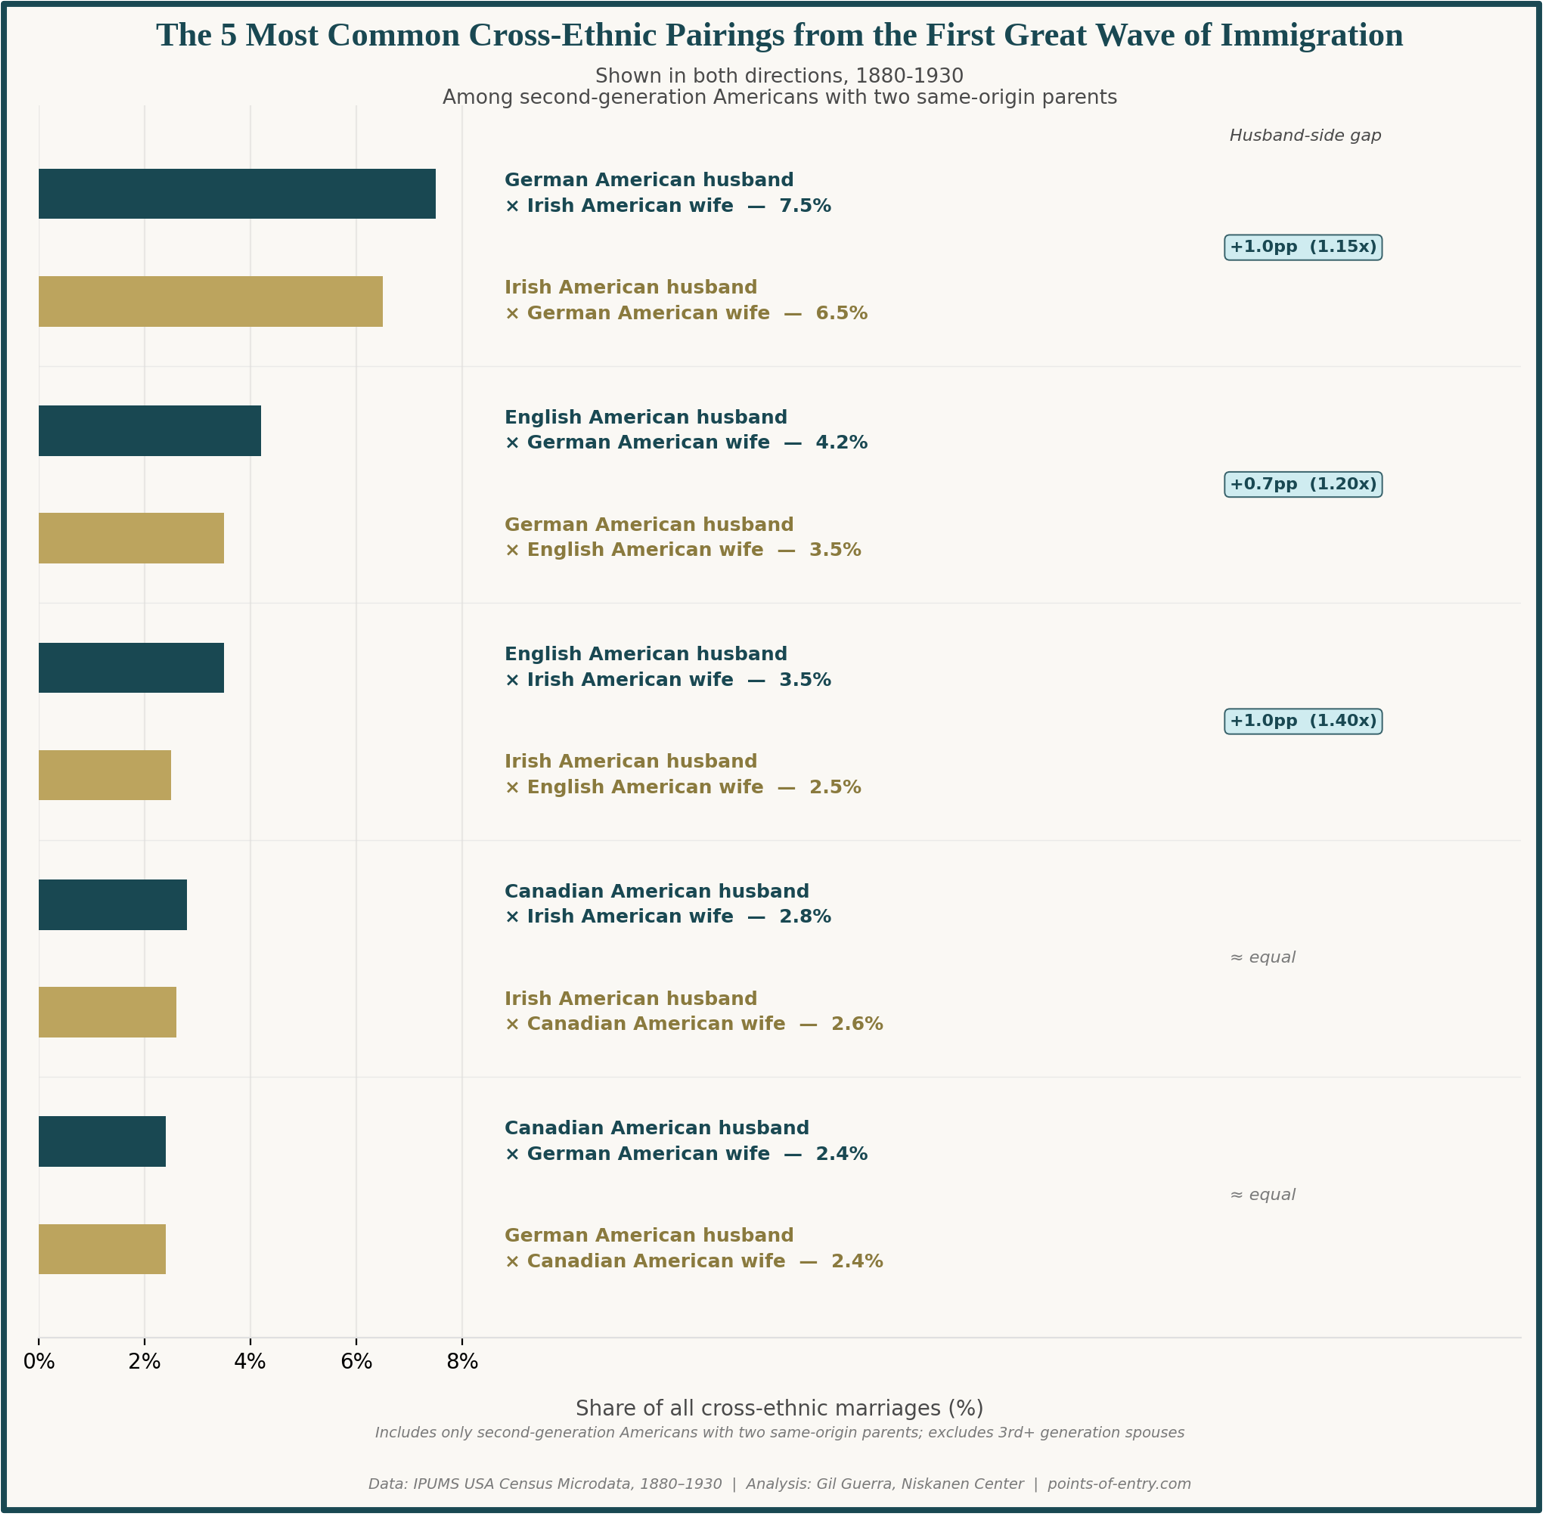
Among second-generation Americans who married into another immigrant community, 35% married an Irish or German American. The most common pairing across all major groups featured a German American husband and an Irish American wife, and the top 10 most common overall pairings all featured either a German or Irish spouse.
Among the 20 largest second-generation ethnic groups, Mexican Americans were the only group that did not have either Irish or German Americans in their top two most common pairings — an indication of how geographically and socially separate the Mexican American marriage market was from the rest of the country.
Of course, raw frequency can be deceiving. German and Irish Americans had the largest populations, making up a combined share of 59% of the entire married second-generation American population. They were also widely dispersed, so some intermarriage was inevitable regardless of cultural affinity.
Once we adjust for factors like population size and geography, the makeup of which groups seemed to have a genuine affinity for each other shifts dramatically.
One Melting Pot or Three?
To find which groups genuinely had a preference for one another, I adjusted for geographic overlap. Since Norwegians and Germans both settled in Wisconsin in large numbers, for example, a baseline number of Norwegian-German American marriages would occur by proximity alone regardless of any cultural affinity.
Three distinct marriage clusters emerged, each internally cohesive and largely closed off from the others.
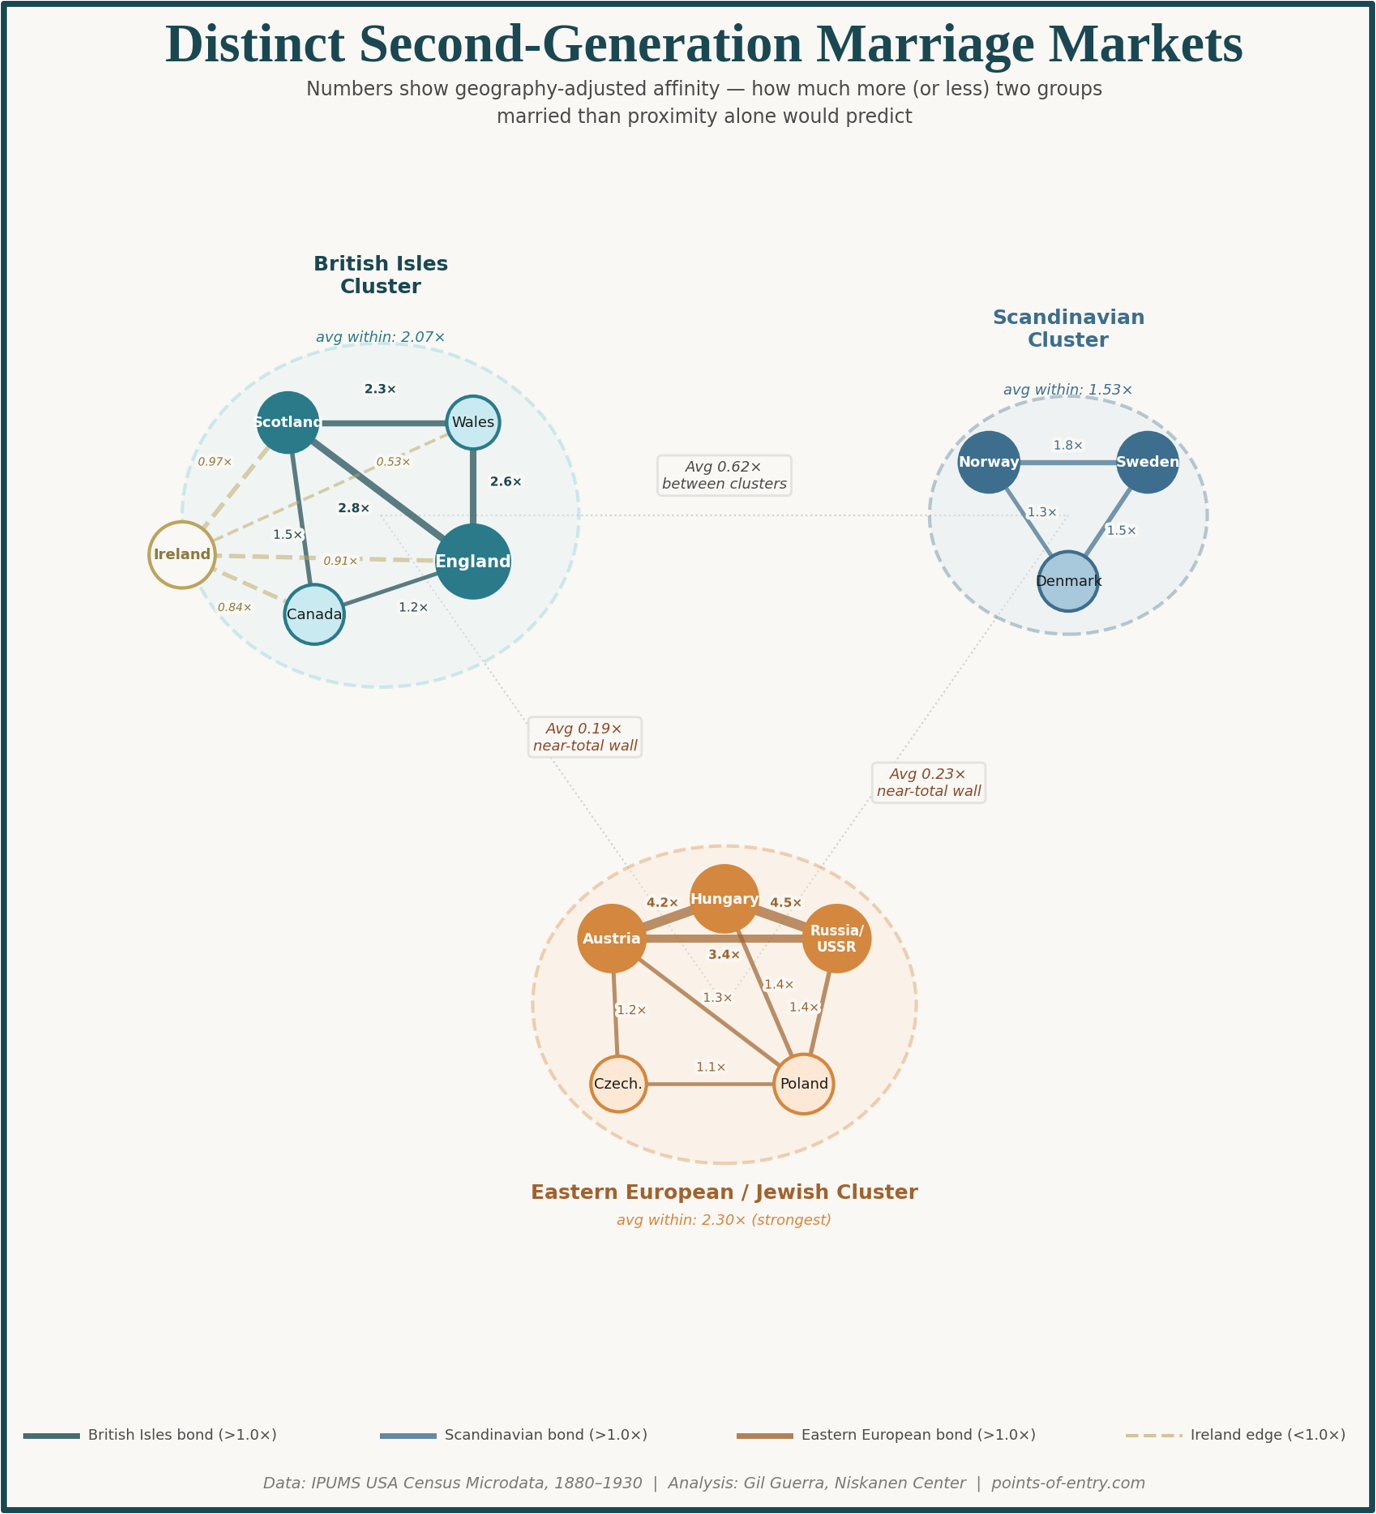
The British Isles cluster is the most intuitive. English, Scottish, and Welsh Americans married each other at two to three times the expected rate: English-Scottish pairings ran at 2.8x, English-Welsh at 2.6x, Scottish-Welsh at 2.3x. Canadians fit comfortably in this group. Irish Americans, meanwhile, were adjacent but not quite inside it — close enough to the door to knock, not quite invited to sit down.
The Scandinavian cluster is smaller and tidier. Norwegian and Swedish Americans married at 1.8x the expected rate, Swedes and Danes at 1.5x, Norwegians and Danes at 1.3x. Every pair was above chance, forming a mutual triangle of preference. Similar languages and shared Lutheran faith sustained a small but enduring Scandinavian American identity.
The Eastern European and Jewish cluster was the strongest of the three, with an average within-group affinity of 2.3x. It was dominated by the highest affinity scores in the entire dataset: Hungarian and Russian Americans married each other at 4.5 times the expected rate, Austrian and Hungarian Americans at 4.2 times, Austrian and Russian at 3.4 times.
These marriages, however, were probably not technically “cross-ethnic.” The likeliest explanation is that this cluster reveals the Ashkenazi marriage network, which operated across national-origin lines that the census drew. The son of Russian Jews marrying the daughter of Hungarian Jews was, from the community’s perspective, not exactly intermarriage. It’s a useful reminder that the census measures what the government could see, not necessarily what communities experienced.
The logic of attraction — shared language, shared faith, shared empire — maps neatly onto these three clusters. The logic of avoidance is harder to explain, and more revealing.
Left at the Altar
I ran the same adjusted analysis to find which groups married at the lowest rates once geography was accounted for. I then visualized the percentage of marriages that we would expect to happen between major groups based on population math but that failed to materialize.
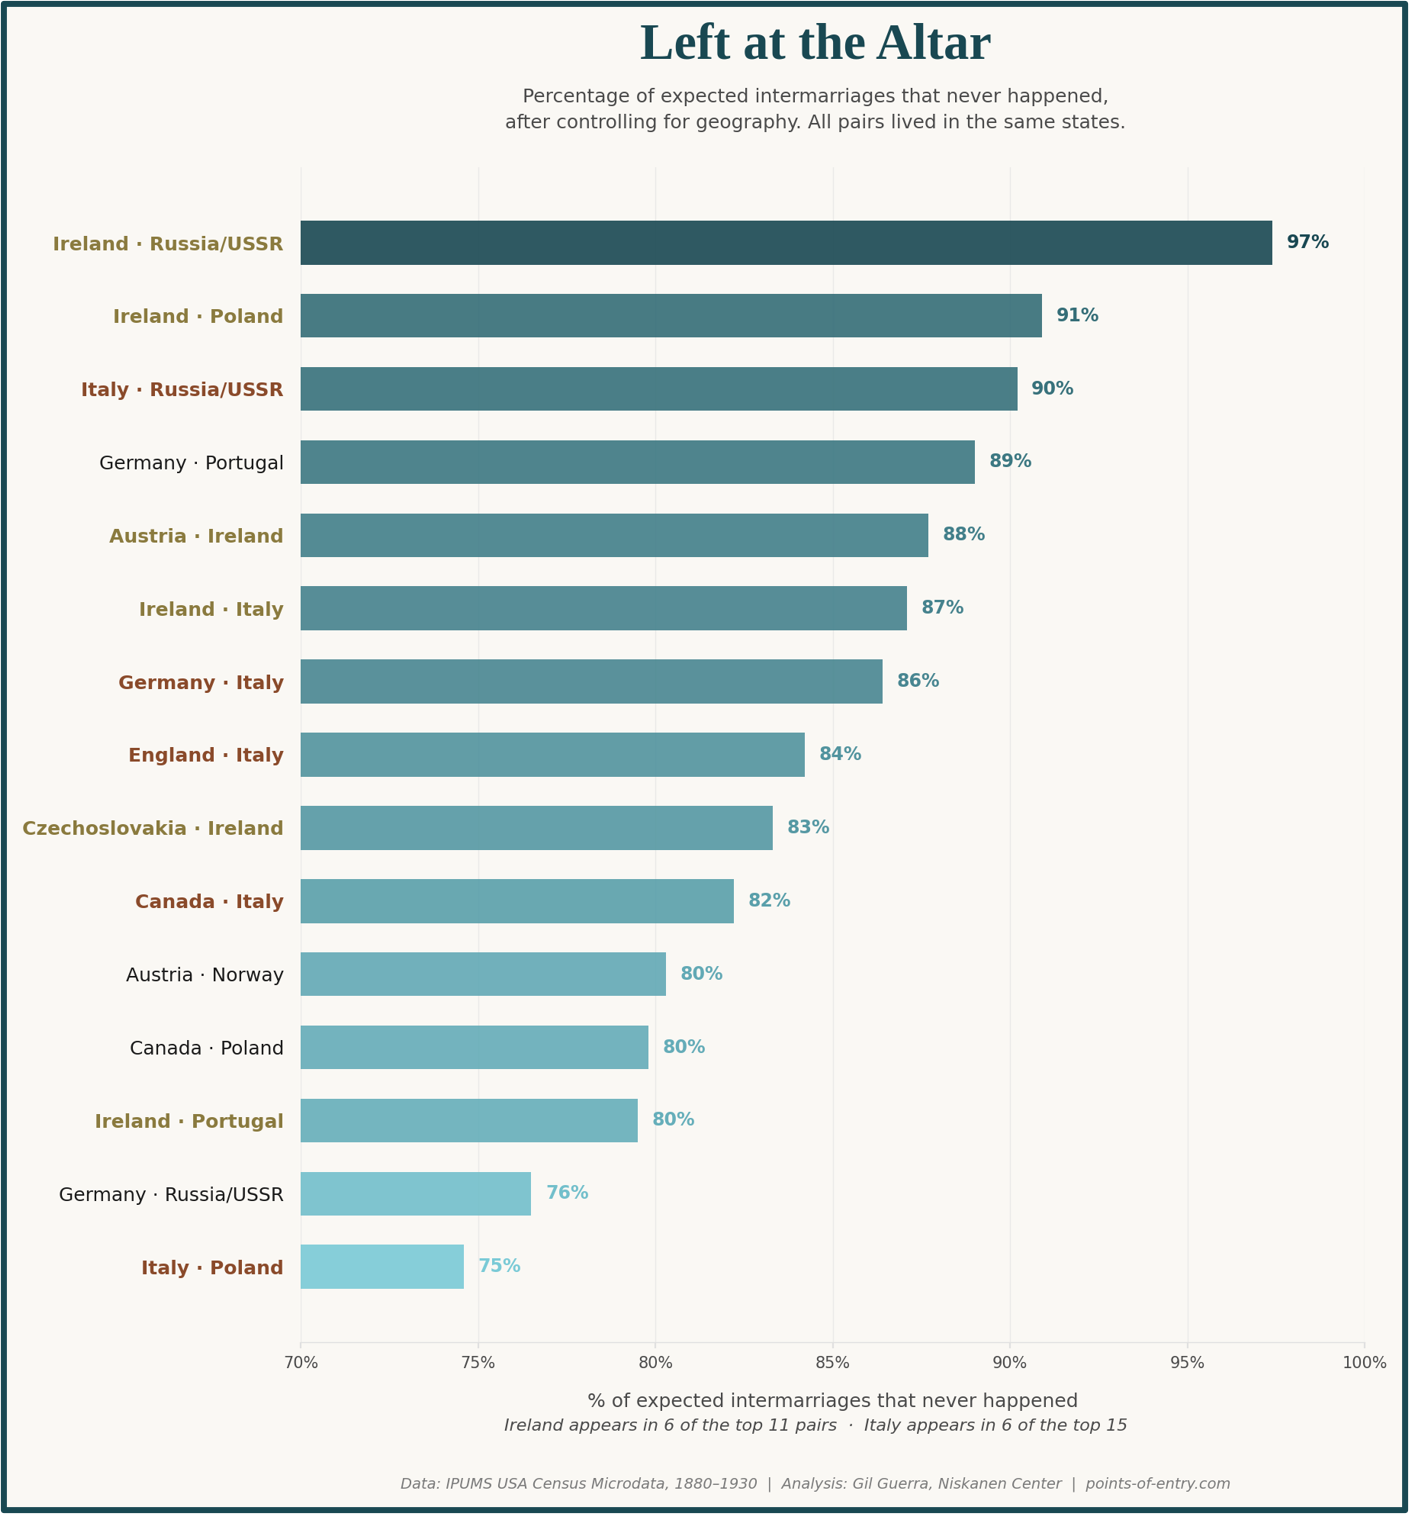
The single most extreme avoidance in the dataset was between Irish and Russian Americans. For every 38 Irish-Russian American marriages the population numbers would predict, only one actually occurred. Despite sharing neighborhoods across the urban Northeast, Irish and Russian Americans almost never met at the altar. Irish-Polish (0.09x) and Irish-Austrian (0.12x) tell a similar story, suggesting an irreconcilable Catholic-Jewish religious divide.
Italian Americans had a different and in some ways more dramatic story. Italian-Russian avoidance (0.10x) was comparable to the Irish-Russian wall, but unlike the Irish, Italian Americans were comparatively insular across the board. Even marriage rates with French Americans, who were fellow Romance speakers, fellow Catholics, and European neighbors in the old country came in at just 0.47x, less than half the expected rate. Italy’s highest affinity with any group in the entire dataset was with Swiss Americans at 0.92x, still below chance.
The Irish-Italian American intermarriage rate deserves special attention because it’s the one that, on paper, shouldn’t be so low, and it challenges some previous theories about assimilation. Both groups were Catholic, concentrated in the same northeastern cities, and excluded from being part of the mainstream Protestant “establishment.” They had more in common with each other than most other pairs of groups in this dataset, and yet they married at just 13% of the expected rate — a level of avoidance nearly as severe as the Irish-Jewish divide.
The likeliest explanation is that the Irish and Italian communities occupied different rungs of the same ladder, and both knew it. The Irish had been arriving in large numbers since the famine in 1845 and had spent decades building institutional power within the American Catholic Church and urban political machines. Italian immigrants, arriving later and poorer, practiced a devotional Catholicism involving street festivals, patron saints, and public processions that many Irish Catholics regarded as harmful to their efforts to make Catholicism appear respectable. For Irish Americans who were steadily climbing toward the mainstream, marrying into a newer and poorer immigrant community risked taking a step backward. For Italian Americans, their tight-knit community was a protective asset, not something to be married out of.
What the Marriage Map Tells Us
One way to read this data is as an affirmation of cultural persistence across generations. In my view, that interpretation would be incomplete. While it is significant that British, Scandinavian, and Jewish Americans showed coherent cultural preferences in the marriage market, those three clusters accounted for only 28% of all cross-community marriages.
The majority, over 60%, involved groups that didn’t belong to any cluster at all. German Americans alone appeared in more than half of all cross-ethnic marriages, not because every group had a special affinity for Germans, but because German Americans were large in number, widely dispersed, and impossible to avoid in a marriage market shaped by proximity.
The avoidance patterns tell a similar story once you look past the affinity ratios to the raw numbers underneath. As we established, Irish and Italian Americans married at just 13% of the expected rate — but they still produced over 26,000 marriages. Irish and Russian Americans, the single most extreme avoidance at 0.03x, produced more than 5,000 marriages during this time period. Across the full dataset, 3.77 million second-generation Americans married someone from a different immigrant community, spanning 722 unique pairings. Nearly every combination you can imagine happened at least once.
If proximity did much of the heavy lifting as the data seems to indicate, then the same group should look very different depending on where it settled — insular in a state where it was concentrated, integrated in a state where it was dispersed. In Part 3, we’ll test that hypothesis state by state.
If you want to explore the data yourself before the next installment, the full interactive dashboard is here. If you have any questions you’d like me to take up in a future installment, email me at gguerra@niskanencenter.org or head to the comments section. And if you enjoyed this entry and would like to follow the series, I hope you’ll subscribe below.
This was a stunning article!! Can't wait for the next two parts. GREAT work!